Future Ozone Layer
Due to action taken under the Montreal Protocol, the stratospheric loading of chlorine and bromine is decreasing and this is expected to lead to recovery of the ozone layer (i.e. an increase in ozone). However, the future evolution of the ozone layer will also depend on other factors, in particular climate change. Research in our group has played an important role in identifying major chemistry-climate feedbacks and in coordinating the most robust recent estimates of future ozone recovery from current state-of-the-art coupled chemistry-climate models (CCMs)
Effect of Coupled Climate Change
Chipperfield and Feng (2002) showed the very important impact of CO2-induced stratospheric chlorine in changing the trajectory of ozone recovery. They used a computationally cheap 2-D latitude-height radiative-dynamical-chemical model coupled with the well-tested TOMCAT stratospheric chemistry scheme. The results were highlighted in the 2006 WMO/UNEP Ozone Assessment and the figure from that report is reproduced below. In particular, the model simulations showed how the cooling effect from simulations with coupled temperature changes (solid lines) overcomes the ozone-depleting impact of increased N2O (dashed lines).

Variation in Northern Hemisphere mid-latitude total column ozone (% change since 1980) from six runs of a 2-D model. The simulations used three different greenhouse gas (GHG) scenarios (A1FI, B1, and A1FI with B1 CH4 emissions), with results shown with (solid lines) and without (dashed lines) stratospheric cooling due to CO2 increases. Also shown are observed past changes from satellite data. Figure 6-11 from WMO/UNEP (2006) and taken from Chipperfield and Feng (2003).
Multi-Model Estimates of Ozone Return Dates
Groups worldwide now run complex 3-D coupled CCMs to simulate the future evolution of the ozone layer. However, analysis of these runs to derive robust estimates of ozone recovery among the model internal variability and model-model differences is a major challenge. Nevertheless the 4-yearly Ozone Assessments need to provide this information to the Parties of the Montreal Protocol.
For the 2018 Ozone Assessment our group coordinated the most comprehensive recent assessment of ozone return dates using output from around 20 CCMs from groups worldwide. Analysis of the models required careful processing to maintain the signal of changing halogens and climate, while removing the model variability. This work was published in the widely cited paper Dhomse et al. (2018) and used extensively in the 2018 Assessment (see example figure below from WMO/UNEP 2018).
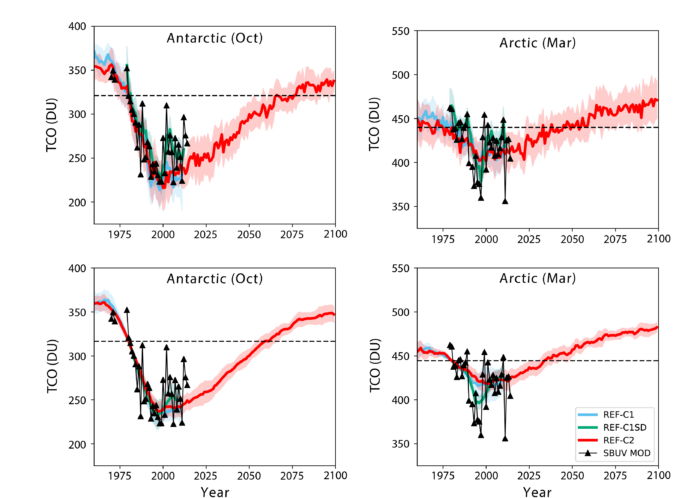
Multi-model mean (MMM1S) total column ozone time series (in Dobson Units, DU) from CCMI simulations REF-C1 (light blue), REF-C1SD (green) and REF-C2 (red) simulations for the (left) SH polar (October) and (right) NH polar (March) regions. The dashed black lines show the 1980 reference value for each latitude band. The top row shows the unadjusted modeled values and the bottom row shows the time series adjusted with respect to mean 1980–1984 observations. Also shown are the merged SBUV observations. Figure 4-18 from WMO/UNEP (2018) and based on Dhomse et al. (2018).
References
Chipperfield, M.P., and W. Feng, Comment on: Stratospheric Ozone Depletion at northern mid-latitudes in the 21st century: The importance of future concentrations of greenhouse gases nitrous oxide and methane, Geophys. Res. Lett., 30, 1389, doi:10.1029/2002GL016353, 2003.
Dhomse, S.S., D. Kinnison, M.P. Chipperfield, et al., Estimates of ozone return dates from Chemistry-Climate Model Initiative simulations, Atmos. Chem. Phys., 18, 8409-8438, doi:10.5194/acp-18-8409-2018, 2018.