Fluxes of Greenhouse Gases and Other Species
We use TOMCAT and its inverse model, INVICAT, to investigate and quantify emissions of a range of greenhouse gases (GHGs) and other trace species. We have produced gridded global and regional inventories for major GHGs including nitrous oxide and carbon dioxide. Through these results we have improved understanding of the global carbon cycle and the impact that widespread use of agricultural fertiliser is having on the atmosphere.
Carbon cycle
Carbon dioxide (CO2) is the most important greenhouse gas in our atmospheric, responsible for over two-thirds of the human impact on the warming of the planet. Whilst global fossil fuel-related emissions of CO2 are fairly well quantified, improving our understanding of the overall carbon balance between the biosphere, atmosphere and oceans is vital.
Our carbon emissions research has been focused mainly on the fluxes from tropical regions, particularly the Amazon rainforest and other parts of South America. In Gloor et al. (2018) we quantified the effect of the 2015/16 El Niño event on tropical carbon emissions to the atmosphere, finding carbon emission anomalies of 0.5 PgC/yr from each of South America and tropical Africa due to drier and warmer local conditions during El Niño. We explored the Amazon’s carbon balance using top-down methods in our highlight paper in Atmospheric Chemistry and Physics (Basso et al., 2023) and in Rosan et al. (2024). In these papers we showed, through assimilation of observations of CO2 and carbon monoxide (CO) made within the Basin, that the Amazon was a small carbon source to the atmosphere during 2010 – 2018, rather than a sink, mainly due to the impact of fires.

Comparison of the 9-year mean of carbon fluxes from INVICAT(prior total flux, posterior total flux, posterior NBE flux (total minus fire emissions) and posterior fire flux) and flux estimates (total, NBE and fire) using a mass balance technique. From Basso et al. (2023).
Nitrous oxide
Nitrous oxide (N2O) is the third most important anthropogenic greenhouse gas and has also become the most significant species in terms of stratospheric ozone depletion since the Montreal protocol banned CFCs. It has a number of natural and anthropogenic sources, with the main source being due to overuse of nitrogen-based fertilsers in large-scale farming across the planet. This has led to the atmospheric N2O burden growing at a rate even faster than our previous highest (‘worst-case’) forecasts.
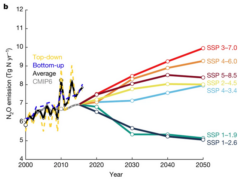
Global anthropogenic N2O emissions compared to marker scenarios based on the SSPs used in CMIP6. Average drived emissions (black) are rising faster than in all Shared Socio-economic Pathways (SSPs). From Tian et al. (2020).
We have published various studies that have quantified global and regional emissions of N2O to the atmosphere. In Thompson et al. (2019) we used INVICAT along with two other global inverse models to show that global N2O emissions were rising quickly and that developing regions in East Asia and South America were responsible for the majority of the increase. We went on to produce the first comprehensive global nitrous oxide budget in Tian et al. (2020), which combined an array of top-down and bottom-up results. The results of this work were included in the 6th IPCC report, and showed that agricultural emissions of N2O due to fertiliser application to croplands were responsible for the increasing N2O emissions, with human-related emissions increasing by 30% over the past four decades. These findings were refined and updated in Tian et al. (2024). We have also contributed to the consolidated European synthesis of methane and nitrous oxide emissions for the European Union and United Kingdom (Petrescu et al., 2021; 2023).
Other species
We have published research on emissions of other species including:
- Ethane (C2H6), which is primarily emitted during the production of oil and natural gas. In Monks et al. (2018) we showed than U.S. emissions of C2H6 were increasing rapidly, likely due to the proliferation of hydraulic fracturing (‘fracking’) across the country. Exploiting co-emission factors with methane (CH4), we showed that U.S. fracking was likely leading to a significant increase in atmospheric CH4.
- Chlorinated very short lived substances (Cl-VSLS) such as dichloromethane (CH2Cl2) and perchloroethylene (C2Cl4), which are emitted to the atmosphere mainly through their industrial uses. We showed that CH2Cl2 emissions had risen by ~85% between 2006 and 2017, mainly due to emissions from East Asia, but that C2Cl4 emissions had dropped by around 25% during the same period (Claxton et al., 2020).
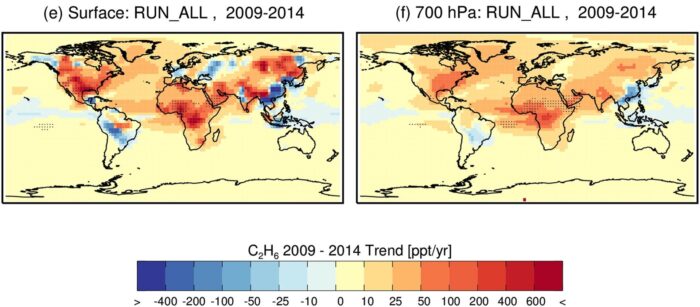
Simulated trends in C2H6 between 2009 and 2014 (ppt/year) from TOMCAT simulations at the surface (left) and at 700 hPa (right). Trends that are significant at the 95% confidence level (p < 0.05) are indicated by the black dots. From Monks et al. (2018).
References
Basso L.S., C. Wilson, M.P. Chipperfield, G. Tejada, H.L.G. Cassol, E. Arai, M. Williams, T.L. Smallman, W. Peters, S. Naus, J.B. Miller, M. Gloor. Atmospheric CO2 inversion reveals the Amazon as a minor carbon source caused by fire emissions, with forest uptake offsetting about half of these emissions. Atmos. Chem. Phys. 9685-9723 23.17, doi: 10.5194/acp-23-9685-2023, 2023.
Claxton T., R. Hossaini, C. Wilson, S.A. Montzka, M.P. Chipperfield, O. Wild, E.M. Bednarz, L.J. Carpenter, S.J. Andrews, S.C. Hackenberg, et al. A Synthesis Inversion to Constrain Global Emissions of Two Very Short Lived Chlorocarbons: Dichloromethane, and Perchloroethylene. J. Geophys. Res. Atmos. 125.12, doi: 10.1029/2019JD031818, 2020.
Gloor E., C. Wilson, M.P. Chipperfield, F. Chevallier, W. Buermann, H. Boesch, R. Parker, P. Somkuti, L.V. Gatti, C. Correia, L.G. Domingues, W. Peters, J. Miller, M.N. Deeter, M.J.P. Sullivan. Tropical land carbon cycle responses to 2015/16 El Niño as recorded by atmospheric greenhouse gas and remote sensing data. Philos. Trans. R. Soc. B: Biol Sci, 373.1760, doi: 10.1098/rstb.2017.0302 2018.
Monks S.A., C. Wilson, L.K. Emmons, J.W. Hannigan, D. Helmig, N.J. Blake and D.R. Blake. Using an Inverse Model to Reconcile Differences in Simulated and Observed Global Ethane Concentrations and Trends Between 2008 and 2014. J. Geophys. Res. Atmos. 11262-11282 123.19, doi: 10.1029/2017JD028112, 2018.
Petrescu A.M.R., C. Qiu, P. Ciais, R.L. Thompson, P. Peylin, M.J. McGrath, E. Solazzo, G. Janssens-Maenhout, F.N. Tubiello, P. Bergamaschi, et al. The consolidated European synthesis of CH4 and N2O emissions for the European Union and United Kingdom: 1990–2017. Earth Syst. Sci. Data. 2307-2362 13.5, doi: 10.5194/essd-13-2307-2021, 2021.
Petrescu A.M.R., C. Qiu, M.J. McGrath, P. Peylin, G.P. Peters, P. Ciais, R.L. Thompson, A. Tsuruta, D. Brunner, M. Kuhnert, et al. The consolidated European synthesis of CH₄ and N₂O emissions for the European Union and United Kingdom: 1990–2019. Earth Syst. Sci. Data. 1197-1268 15.3, doi: 10.5194/essd-15-1197-2023, 2023.
Rosan T.M., S. Sitch, M. O'Sullivan, L.S. Basso, C. Wilson, C. Silva, E. Gloor, D. Fawcett, V. Heinrich, J.G. Souza, et al. Synthesis of the land carbon fluxes of the Amazon region between 2010 and 2020. Commun. Earth Environ., 5, doi: 10.1038/s43247-024-01205-0, 2024.
Thompson R.L., L. Lassaletta, P.K. Patra, C. Wilson, K.C. Wells, A. Gressent, E.N. Koffi, M.P. Chipperfield, W. Winiwarter, E.A. Davidson, H. Tian, J.G. Canadell. Acceleration of global N₂O emissions seen from two decades of atmospheric inversion. Nature Climate Change. 993-998 9.12, doi: 10.1038/s41558-019-0613-7, 2019.
Tian H., R. Xu, J.G. Canadell, R.L. Thompson, W. Winiwarter, P. Suntharalingam, E.A. Davidson, P. Ciais, R.B. Jackson, G. Janssens-Maenhout, et al. A comprehensive quantification of global nitrous oxide sources and sinks. Nature. 248-256 586.7828, doi: 10.1038/s41586-020-2780-0, 2020.
Tian H., N. Pan, R.L. Thompson, J.G. Canadell, P. Suntharalingam, P. Regnier, E.A. Davidson, M.Prather, P. Ciais, M. Muntean, et al. Global nitrous oxide budget (1980–2020). Earth Syst. Sci. Data. 2543-2604 16.6, doi: 10.5194/essd-16-2543-2024, 2024.