
Tropospheric Ozone
Ozone (O3) is a potent air pollutant in the lower troposphere and an important short-lived climate forcer (SLCF) in the upper troposphere. It is formed through the reaction of nitrogen oxides (NOx) and volatile organic compounds (VOCs) in the presence of sunlight with a lifetime of several days.
Long-term Lower Tropospheric Ozone Records:
Pope et al. (2023) investigated long-term spatiotemporal variability (1996-2017) in lower tropospheric column ozone (LTCO3, surface–450 hPa sub-column) by merging multiple European Space Agency–Climate Change Initiative (ESA-CCI) products (GOME-1,1996–2003; SCIAMACHY, 2003–2010; OMI, 2005–2017) derived by Rutherford Appleton Laboratory (RAL) Space. We found that these satellite products had sufficient information content (degree of freedom of signal) up to 0.8) and comparisons with ozonesondes highlighted negligible drift in the instrument biases. Therefore, the three products were sufficiently stable to generate the first long-term satellite record of LTCO3.
Comparing the LTCO3 differences between the 1996–2000 and 2013–2017 5-year averages, we find sizeable positive increases (3.0–5.0 DU) in the tropics/sub-tropics, while in the northern mid-latitudes, we find small-scale differences in LTCO3. Therefore, we conclude that there has been a substantial increase in tropical/sub-tropical LTCO3 during the satellite era, which is consistent with tropospheric column ozone (TCO3) records from overlapping time periods (e.g. 2005–2016).
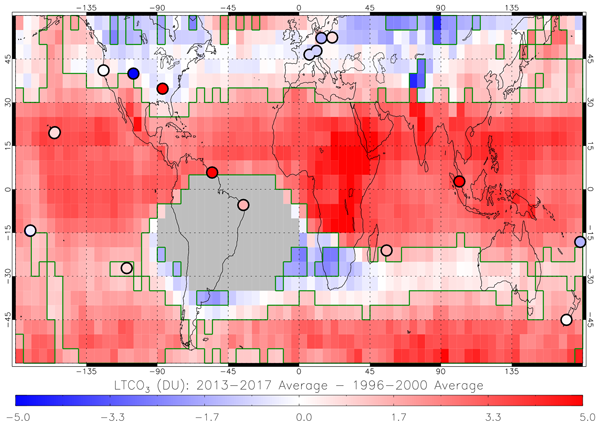
Figure 1: LTCO3 (DU) merged data set from GOME-1 (1996–2002), SCIAMACHY (2003–2004) and OMI (2005–2017) where the difference between the 2013–2017 average and 1996–2000 average is shown. Green polygon-outlined regions show substantial differences (95 % confidence level and where the absolute difference >1.0 DU) using the Wilcoxon rank test. Grey pixels are where the South Atlantic Anomaly influence on retrieved LTCO3 has been masked out. Circles show differences in ozonesonde LTCO3 (DU) over the same time periods as the merged satellite record.
Pope, R. J., Kerridge, B. J., Siddans, R., Latter, B. G., Chipperfield, M. P., Feng, W., Pimlott, M. A., Dhomse, S. S., Retscher, C., and Rigby, R.: Investigation of spatial and temporal variability in lower tropospheric ozone from RAL Space UV–Vis satellite products, Atmos. Chem. Phys., 23, 14933–14947, https://doi.org/10.5194/acp-23-14933-2023, 2023.
Dataset on Zenodo: Investigation of spatial and temporal variability in lower tropospheric ozone from RAL Space UV-Vis satellite products - Dataset. https://doi.org/10.5281/zenodo.10184946
Tropospheric Ozone Radiative Effects
Using state-of-the-art satellite ozone profile products, and the TOMCAT chemical transport model (CTM), Pope et al., (2024) provided an updated estimate of the tropospheric ozone radiative effect (TO3RE) and observational constraint on its variability over the decade 2008–2017. Previous studies have shown the short-term (i.e. a few years) globally weighted average TO3RE to be 1.17 ± 0.03 Wm−2. However, from our analysis, using decadal (2008–2017) ozone profile datasets from the Infrared Atmospheric Sounding Interferometer (IASI), average TO3RE ranges between 1.21 and 1.26 Wm−2. The three IASI products used were IASI-FORLI, IASI-SORID and IASI-IMS (i.e. product generated by NCEO RAL Space). Over this decade, the modelled and observational TO3RE linear trends show a negligible change (e.g. ± 0.1% yr−1) (see Figure 2). Two model sensitivity experiments fixing emissions and meteorology to 1 year (i.e. start year – 2008) showed that temporal changes in ozone precursor emissions (increasing contribution) and meteorological factors (decreasing contribution) had counteracting tendencies, leading to a negligible globally weighted average TO3RE trend. Therefore, the overall radiative influence from tropospheric ozone had yielded negligible impact of climate over the 2008-2017 decade.
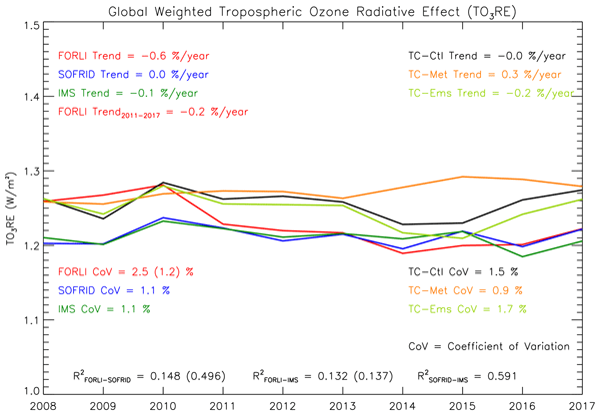
Figure 2. Annual global mean time series of TO3RE (W m−2); between 2008 and 2017, for IASI-FORLI (solid red), IASI-SOFRID (solid blue), and IASI-IMS (solid green). TOMCAT simulation (solid black), TOMCAT with fixed emissions (solid lime), and TOMCAT with fixed meteorology (solid orange) are also shown. The linear trend (% yr−1) is shown as well as the percentage coefficient of variation (CoV). The correlation between IASI time series is shown by the R2 values. TC represents TOMCAT. The IASI-FORLI trend for 2011 to 2017 is also shown as well as the CoV and R2 in brackets in addition to the statistical metrics over the full time period due to record inhomogeneities prior to 2011.
Pope, R. J., Rap, A., Pimlott, M. A., Barret, B., Le Flochmoen, E., Kerridge, B. J., Siddans, R., Latter, B. G., Ventress, L. J., Boynard, A., Retscher, C., Feng, W., Rigby, R., Dhomse, S. S., Wespes, C., and Chipperfield, M. P.: Quantifying the tropospheric ozone radiative effect and its temporal evolution in the satellite era, Atmos. Chem. Phys., 24, 3613–3626, https://doi.org/10.5194/acp-24-3613-2024, 2024.
Impact of COVID-19 on European Tropospheric Ozone
Pimlott et al., (2025) investigated how activity restrictions during the COVID-19 pandemic caused large-scale reductions in O3 precursor emissions, which in turn substantially reduced the abundance of tropospheric O3 in the Northern Hemisphere. Satellite records of LTCO3 from RAL Space highlight large reductions in O3 during the COVID-19 period (2020), which persisted into 2021 and 2022. The European domain average O3 reduction ranged between 2.0 and 3.0 DU (11.0 %–14.6 %). These satellite results were supported by the TOMCAT CTM through several model sensitivity experiments to account for changes in emissions and the impact of the meteorological conditions in 2020. Here, the business-as-usual (BAU) emissions were scaled by activity data (i.e. anonymized mobility data from big tech companies) to account for the reduction in O3 precursor emissions. The model simulated large O3 reductions (2.0–3.0 DU), similar to the satellite records, where approximately 66 % and 34 % of the O3 loss can be explained by emission changes and meteorological conditions, respectively. Our results also show that the reduced flux of stratospheric O3 into the troposphere accounted for a substantial component of the meteorological signal in the overall lower-tropospheric O3 levels during the COVID-19 period.
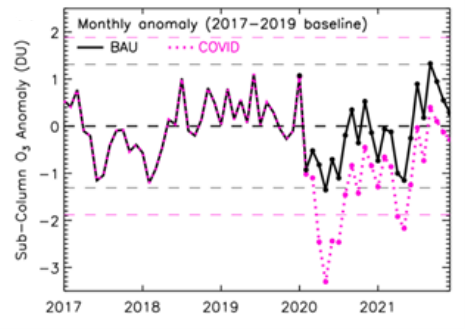
Figure 3: TOMCAT European LTCO3 anomalies (DU) between 2017 and 2021(baseline of 2017–2019). The BAU and COVID anomalies are shown by the solid black dotted and pink lines, respectively. Horizonal dashed lines indicate ±2σ from the average of the record.
Pimlott, M. A., Pope, R. J., Kerridge, B. J., Siddans, R., Latter, B. G., Ventress, L. J., Feng, W., and Chipperfield, M. P.: Large reductions in satellite-derived and modelled European lower-tropospheric ozone during and after the COVID-19 pandemic (2020–2022), Atmos. Chem. Phys., 25, 4391–4401, https://doi.org/10.5194/acp-25-4391-2025, 2025.
Dataset on Zenodo: TOMCAT model data & IASI/GOME-2B satellite data of European ozone between 2008 - 2023 - Data set. https://doi.org/10.5281/zenodo.10424302
South American Biomass Burning Ozone Trends
The decline in Amazonian deforestation rates and biomass burning activity between 2001 and 2012 had been shown to reduce air pollutant emissions (e.g., aerosols) and improve regional air quality. However, in the Cerrado region (savannah grasslands in northeastern Brazil), Pope et al., (2020) showed that satellite observations revealed increases in fire activity and tropospheric column nitrogen dioxide (NO2) (an ozone precursor) during the burning season (August-October, 2005–2016), which had partially offset these previous air quality benefits. Simulations from the TOMCAT CTM captured this increase in NO2 with a surface increase of ~1 ppbv per decade. Unfortunately, robust long-term satellite records of LTCO3 over South America are limited given a range of issues (e.g. the South Atlantic Anomaly), so the well-evaluated TOMCAT CTM was utilised to investigate changes in O3. Here, the TOMCAT suggests that Cerrado region surface ozone is increasing by ~10 ppbv per decade. Given the substantial positive fire-sourced O3 increases in the region, if not mitigated, these trends will enhance the regional health risks and impacts from expected future enhancements in South American biomass burning activity under climate change.
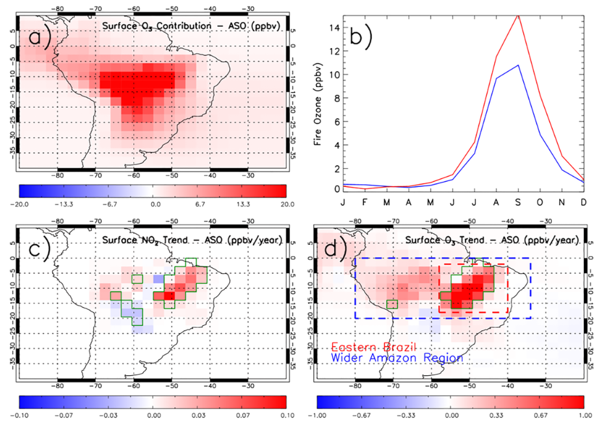
Figure 4: a) Average (August-September-October (ASO), 2005–2016) contribution of fire‐sourced O3 to Amazon surface O3 concentrations (ppbv). b) Seasonal cycle in surface fire‐sourced O3 (ppbv) in the Eastern Brazil and Wider Amazon regions (red and blue dashed regions in (d)). Trends in TOMCAT model surface (c) NO2 (ppbv/year) and (d) O3 (ppbv/year) for the ASO average between 2005 and 2016. Green polygon‐outlined areas show regions of significant trends above the 90% CL.
Pope, R. J., Arnold, S. R., Chipperfield, M. P., Reddington, C. L. S., Butt, E. W., Keslake, T. D., Feng, W., Latter, B. G., Kerridge, B. J., Siddans, R., Rizzo, L., Artaxo, P., Sadiq, M., and Tai, A. P. K.: Substantial increases in Eastern Amazon and Cerrado biomass burning-sourced tropospheric ozone, Geophys. Res. Lett., 47, e2019GL084143, https://doi.org/10.1029/2019GL084143, 2020.